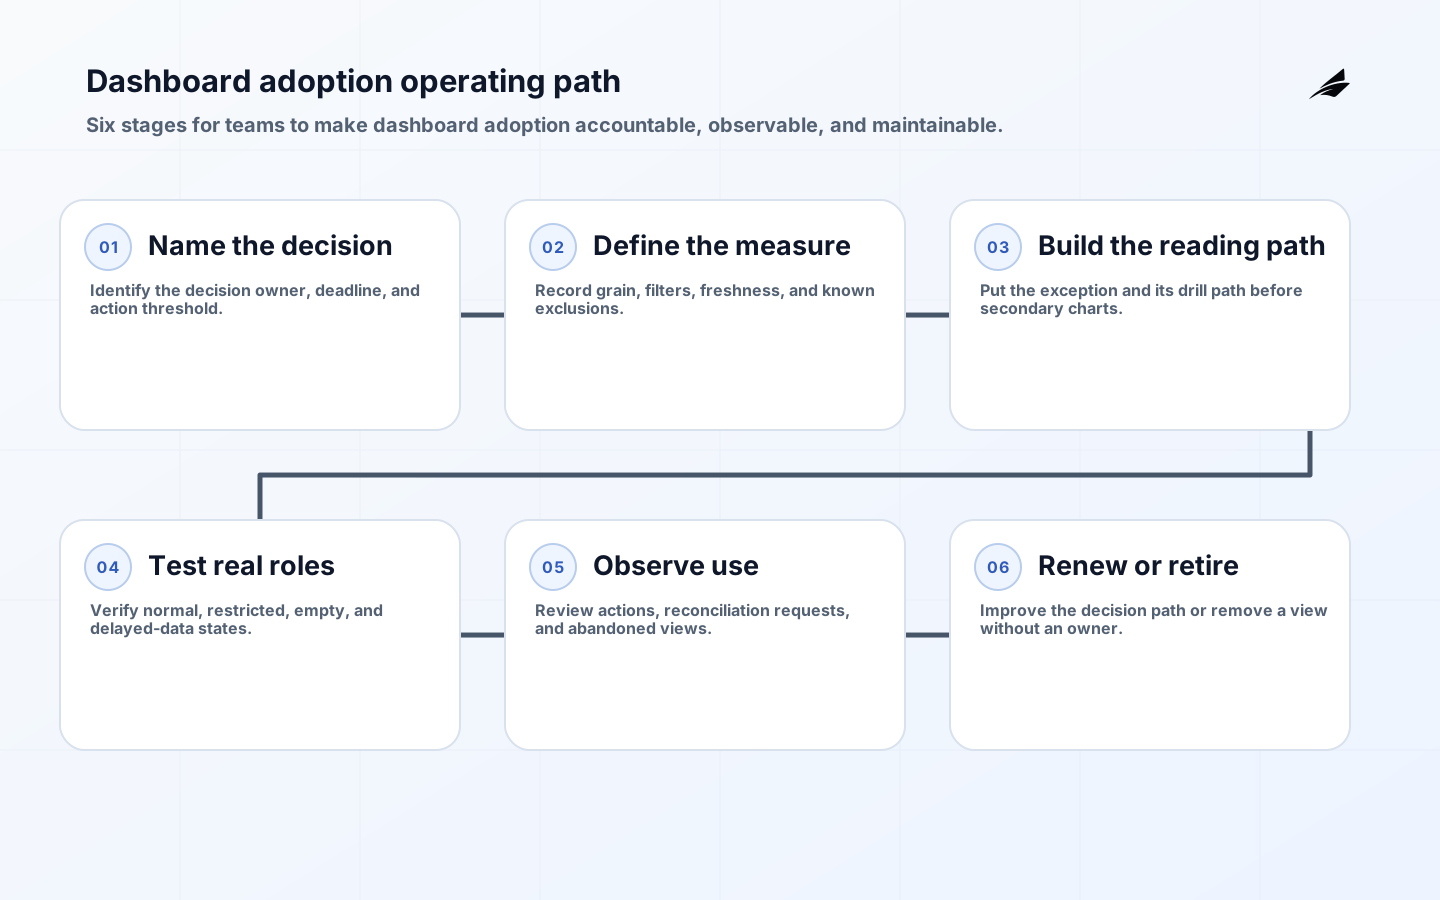
Dashboard adoption becomes useful when it makes which operating exception deserves action this week easier to do with evidence people can inspect. Treat a dashboard as an operating product, not a one-off technical deliverable: its promise is bounded by a named review and the people who must act after it. The practical starting point is a weekly service review that currently begins by merging three spreadsheet exports. Before a team discusses tools, write down who decides, what they need to know, when the answer must be ready, and what happens when the answer is uncertain. That gives the work a testable purpose and stops an attractive interface or a successful job run from being mistaken for a dependable decision service.
Why dashboard adoption needs an operating definition
The first definition should state the population, time cut-off, filters, and action threshold. It should also name the person accountable for a change and the reader who must recognize an exception. W3C PROV overview is a useful reference point because it describes provenance as relationships among data, activities, and agents. In practice, that means a reader should be able to move from a result to its source and transformation without relying on private memory. Do not promise perfect certainty. Promise a visible boundary: what the result includes, when it was last known to be complete, and the route to challenge it.

Set the dashboard adoption decision boundary
A narrow boundary reduces both delivery risk and later maintenance. Begin with which operating exception deserves action this week, then define the action threshold and the acceptable delay. Separate the authoritative output from exploratory analysis. A certified output needs an owner, a publication rule, and a known failure state; exploratory work can remain flexible as long as it is not presented as settled fact. This distinction is especially important when a dashboard becomes an input to another system, because an informal convention quickly turns into an undocumented dependency.
| Question | Decision-ready answer |
|---|---|
| Who acts? | Name the accountable role and the decision that follows the result. |
| What is counted? | State the entity, grain, filters, time basis, and exclusions. |
| When is it usable? | Define the freshness or completion condition and the cutoff. |
| What happens on doubt? | Give readers an investigation path and an escalation owner. |
Build controls into dashboard adoption
The significant risk is a familiar-looking chart whose total cannot be reconciled during a live review. Prevent it by making the publication contract explicit before scaling distribution. NIST SP 800-53 Rev. 5 frames controls as part of a broader system of safeguards; applied here, the useful question is whether a control helps a real person detect, contain, or recover from an incorrect result. Role-aware access and a visible restricted-state message is not a final checklist item. It is part of the reader experience. A restricted user, a delayed source, and an empty result each need a plain explanation that distinguishes absence, permission, and service degradation.
Deliver dashboard adoption as a maintained service
Release planning should test the situations users will actually meet. For dashboard adoption, include a representative reader and operating failure rather than only a successful technical path. Use a representative input, a boundary case, a delayed or missing input, and the expected recovery path. Record the owner and completion signal for each handoff. OpenTelemetry signals distinguishes operational signals such as logs, metrics, and traces; the exact tooling is less important than joining the technical signal to the reader-visible state. When a delay or defect occurs, the team should be able to answer what changed, who was affected, whether a prior result was replaced, and what action is now safe.
Measure whether dashboard adoption earns its cost
Measure the time from an exception appearing to an assigned follow-up, plus sampled reader confidence, but interpret those signals in the context of the decision. A high view count, a green scheduler, or a successful deploy can coexist with a result that nobody can use. Pair technical evidence with a small review of real decisions: did the result arrive in time, did it alter the next action, and could a reader explain an unexpected value? W3C Data Catalog Vocabulary version 3 supports the discipline of recording a dataset's description and responsibility. That context turns an incident or disagreement into a traceable operational question instead of a search through screenshots and chat history.
| Signal | How to use it | Misleading interpretation to avoid |
|---|---|---|
| Freshness or completion | Compare the published state with the declared service promise. | Assuming the latest timestamp means all intended data arrived. |
| Quality or validation result | Locate the failing boundary and affected consumer. | Treating a passing technical check as proof of business meaning. |
| Reader behavior | Look for actions, escalations, and recurring workarounds. | Equating a page view or query with a supported decision. |
| Change record | Connect an observed difference to a release or source event. | Blaming the most recent deployment without checking the lineage. |
Make change to dashboard adoption deliberate
Every change needs a consumer view. For dashboard adoption, test the proposed behavior where it affects a real decision, not only where it is implemented. Classify it as compatible, conditionally compatible, or breaking; then state the migration window and the evidence that makes completion credible. A new column may be harmless to one consumer and disruptive to another that infers a schema. A revised definition may be mathematically sound yet invalidate a comparison with last quarter. Preserve the earlier behavior long enough to reconcile it where the decision warrants it, and remove it only after the accountable owner confirms that users have moved.
Run an operating review for dashboard adoption
Use a short operating review after a real release, incident, or decision cycle. Start with evidence rather than a status update: reproduce the reader path and confirm that a decision owner can trace a real exception from the dashboard to the affected population and follow-up. Save the query, record, deployment reference, or run state that answers the question. This exercise tests whether the published explanation works outside the delivery team and whether the action threshold still matches the workflow. It also separates a legitimate limitation from an undocumented assumption. When the answer depends on private memory or a side spreadsheet, record the missing context beside the asset and assign an owner to correct it before the next cycle.
The review should inspect exports, repeated requests for screenshots, and review-time reconciliation. Classify each finding by its effect on meaning, availability, confidentiality, or recoverability, then decide whether a definition change, access change, technical fix, or reader-interface change is needed. Give temporary exceptions an expiry and notify the people whose decisions may change. A quiet system is not automatically a healthy one; recurring workarounds often show that readers do not trust the normal path. Closing the loop with a named decision keeps dashboard adoption tied to useful operations rather than a growing collection of unmanaged outputs.
Related data decisions
This work becomes easier when adjacent practices are explicit. KPI governance helps make ownership and meaning visible; data lineage addresses a neighboring decision boundary; and operational metrics is useful when the team needs to connect the operating result to a broader analytics workflow. Link the work in the backlog as well as in the documentation: many failures attributed to dashboard adoption begin upstream in an unclear source or downstream in an undefined decision rule.
Key takeaways for dashboard adoption
- Begin dashboard adoption with a named decision, accountable owner, and usable-by time.
- Publish grain, definitions, freshness, limitations, and escalation routes where readers work.
- Test normal, restricted, missing, delayed, and changed states before broadening the audience.
- Use technical signals and real decision evidence to improve, constrain, or retire the service.
Frequently asked questions about dashboard adoption
What should be built first? Start with the smallest path that changes which operating exception deserves action this week; it should have one accountable owner and a stated fallback when the result is unavailable. How much governance is enough? Enough to expose the population, time cut-off, filters, and action threshold and to approve change without relying on memory. Add formality only where the consequence of a wrong result justifies it. When should a release be blocked? Block it when the affected audience cannot identify the state, investigate a material result, or recover from the expected failure mode. When is retirement appropriate? Retire or merge the asset when its decision, trusted source, or accountable reader no longer exists, while retaining a concise record of what replaced it.
Conclusion: make dashboard adoption dependable
The durable version of dashboard adoption is not defined by its interface, framework, or volume of data. It is defined by whether people can use it to make which operating exception deserves action this week with a clear understanding of meaning, timing, and limits. Keep the first boundary small, make ownership visible, rehearse change and recovery, and review the evidence from real use. That is how a promising analytics capability becomes a maintained part of operations.