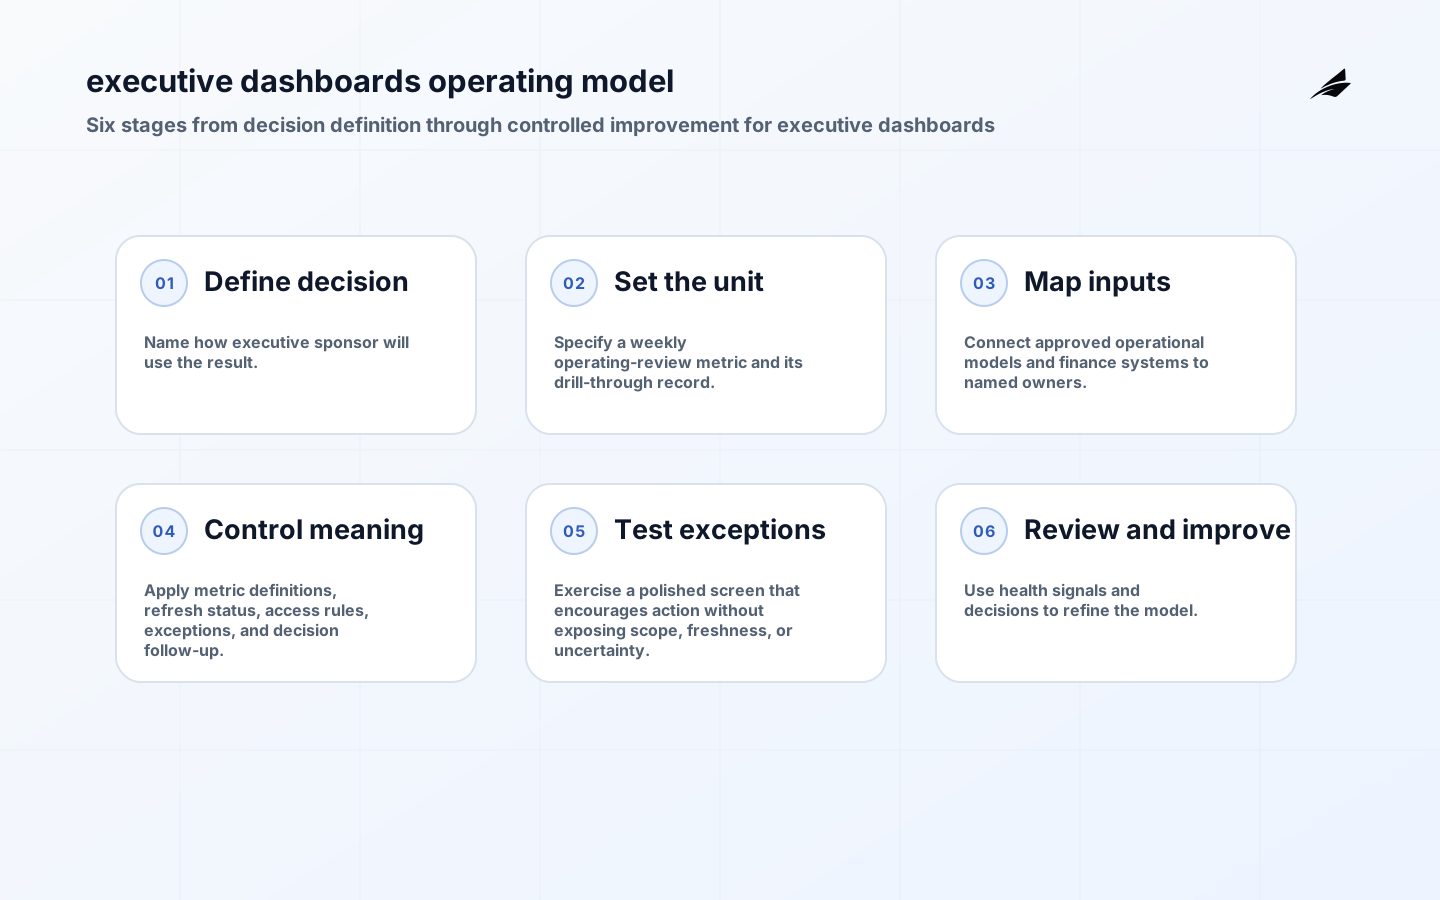
An executive dashboard is not a dashboard feature or a warehouse setting in isolation. It is a working agreement about a concise decision surface that connects a leadership question to a traceable, current measure. That agreement must survive ordinary changes: a source system is corrected, a definition is revised, a person joins the team, or an exception requires someone to act in the dashboard governance. When the agreement is implicit, teams may still produce numbers, but they cannot reliably explain why a number changed or whether a decision should follow in the dashboard governance. This guide starts with one specific unit: a weekly operating-review metric and its drill-through record. It asks what should be true before an executive sponsor uses that unit to change staffing, investment, or delivery priorities. The result is deliberately practical. In the dashboard governance: A team can use it to decide what to capture, where to test it, who approves a change, and what evidence to retain when the answer is challenged
Translate the Leadership Question into a Measure
For this use case, an executive dashboard means more than collecting data. It connects a decision to a defined unit, an accountable owner, and a repeatable check in the dashboard governance. The relevant inputs come from approved operational models and finance systems. A useful definition also states its boundary: which cases are included, what timestamp governs the result, and when a record is too incomplete to use Power BI star schema guidance provides implementation context, while PROV-DM: The PROV Data Model is a helpful model for recording the entities, activities, and agents behind a result. In the dashboard governance: Those references do not prescribe a single product; they reinforce the habit of making provenance and behavior inspectable

| Question | Working answer | Evidence to keep |
|---|---|---|
| Decision | Should the executive sponsor change staffing or investment this week? | Named decision owner and review date |
| Unit of analysis | One weekly operating-review metric by product line and region. | Stable identifier and timestamp rule |
| Authoritative input | Certified order and finance models with a stated refresh cutoff. | Source owner and refresh expectation |
| Failure boundary | Late, partial, or unreconciled inputs that pause or qualify publication. | Visible exception state and escalation path |
Set the Decision Window. Before the Metric
Begin with the moment when the executive sponsor must act. Ask what action changes when the measure moves, what comparison is meaningful, and which delay makes the information less useful in the dashboard governance. This prevents the familiar trap of building a broad reporting surface before agreeing on its job during the dashboard governance review 1. In workshops, use recent examples rather than hypothetical requirements: one normal case, one disputed case, and one case where the source arrived late in the dashboard governance. The team should be able to trace each example from input to outcome and say who can resolve ambiguity Plain-language BI dashboard guidance places this work alongside the wider data operating model.
- Write the decision as a sentence: when this signal changes, executive sponsor will consider a specific action.
- In the dashboard governance: Name the unit and grain; do not mix an account, event, invoice, and weekly aggregate without an explicit relationship
- In the dashboard governance: Record the inclusion and exclusion rules in language that business and technical owners can both review
- Assign one accountable owner for the definition and one operational contact for failures in the dashboard governance.
- In the dashboard governance: Set a freshness expectation that reflects the decision window instead of using “real time” as a default
- Preserve examples that demonstrate an expected result, an expected exception, and a rejected record in the dashboard governance.
Protect the Number with a Data Contract
A sound design separates source facts from derived meaning. The source can say that a record arrived; a model, policy, or calculation explains how that record contributes to a decision in the dashboard governance. For executive dashboards, document metric definitions, refresh status, access rules, exceptions, and decision follow-up. Treat each as a control point with a measurable condition and a response in the dashboard governance. If the condition fails, the system should mark the output as incomplete, delay publication, or route it for review; silently substituting an old value turns a technical convenience into an unrecorded business decision Understand star schema and its importance to Power BI is useful background for designing these operational controls, and dbt documentation: data tests offers patterns for making data systems observable and maintainable.
| Control point | Question to settle | Operational response |
|---|---|---|
| Identity | How is the weekly metric's product, region, and period recognized across inputs? | Reject or quarantine ambiguous matches. |
| Time | Which event or processing time governs the result? | Show lateness and rerun rules. |
| Change | Who can alter logic or thresholds? | Require review, versioning, and a release note. |
| Exception | What makes an output unsafe to use? | Expose status, owner, and next action. |
Test the Exceptions. That Change the Call
Implementation should start small enough to verify. Create a thin path from a representative source record through the transformation or calculation to the consumer-facing result in the dashboard governance. Test the path against real examples, including the failure pattern already identified: a polished screen that encourages action without exposing scope, freshness, or uncertainty. Tests should check values, but they should also check behavior: whether a missing input is visible, whether a correction triggers the expected recomputation, and whether access rules prevent the wrong audience from seeing sensitive detail in the dashboard governance. In the dashboard governance: Record test fixtures with their expected outcomes so a later change can be reviewed rather than remembered
Version Meaning Without Freezing Delivery
Definitions evolve because the business evolves. The aim is not to stop change; it is to make change legible in the dashboard governance. Give each material revision an effective date, a short reason, an approver, and a statement of downstream impact in the dashboard governance. A consumer should be able to distinguish a changed result caused by new business activity from one caused by revised logic in the dashboard governance. For executive dashboards, executive reporting owner should coordinate the review, but subject-matter owners must confirm whether the changed rule still represents the work. In the dashboard governance: This is particularly important when historical comparisons are reused in planning or performance conversations
- Keep a concise definition page for executive dashboards, including owner, purpose, formula or rule, and known limitations.
- In the dashboard governance: Version transformation logic, dashboards, and policies together when they change the same reader-facing number
- Require an impact check for upstream schema changes and downstream reports before release in the dashboard governance.
- In the dashboard governance: Use role-based access and minimize detail where the consumer does not need underlying personal or financial records
- In the dashboard governance: Review aged exceptions; an unresolved exception is part of the measure’s meaning, not a separate support problem
- In the dashboard governance: Schedule a periodic challenge session in which a new reviewer attempts to reproduce the result from retained evidence
Watch the Measure and Its Evidence Path
The operating view for executive dashboards should include both the result and its health. Useful health signals include source freshness, record volume relative to expectation, failed checks, unmatched identities, model run duration, and the age of unresolved exceptions in the dashboard governance. Pair each signal with an owner and a threshold that creates a concrete next step during the dashboard governance review 1. A zero-error screen is not automatically healthy if it is quiet because an upstream feed stopped in the dashboard governance. Conversely, a visible, contained exception may be safer than a superficially clean figure in the dashboard governance. KPI governance in plain language explores the definition and ownership discipline teams commonly need when expanding this operating model.
Keep a worked decision beside the dashboard definition. For a weekly staffing review, retain the reporting cutoff, the certified order and finance inputs, the measure version, the exception state, and the sponsor's decision to act or wait. If the number is corrected later, identify the people who saw the earlier result and explain whether the decision remains valid. This small record makes plain language operational: the reader can distinguish a changed business outcome from a changed calculation and can challenge the result without starting a new reconciliation exercise.
Key takeaways
- Executive dashboards are useful only when they are attached to a specific decision and a defined unit of analysis.
- Make source, transformation, ownership, and freshness visible to the people who rely on the output in the dashboard governance.
- Test the exceptions that would change a decision, not just the happy-path calculation in the dashboard governance.
- Version important changes and explain their impact on historical comparisons.
- Monitor the health of the data flow as well as the outcome shown to users in the dashboard governance.
- Use operational metrics in plain language to connect this practice to the next implementation decision.
Frequently asked questions
How do we know whether executive dashboards are ready for wider use?
For executive dashboards, begin with a bounded audience and one recurring decision. In the dashboard governance: Expand only after users can state the definition in their own words, the accountable owner can resolve a representative exception, and the team has observed corrections and late inputs under normal operating pressure Wider access before those conditions are met tends to multiply interpretation disputes rather than create confidence
What should happen when the underlying data changes?
When executive dashboards inputs change, preserve the changed record and identify the results that depend on it. The owner should decide whether to recompute, annotate, or pause publication according to the documented decision window Explain material revisions to people who acted on the earlier result; for executive dashboards, silence turns a normal correction into an avoidable confidence problem.
Conclusion
A dependable executive dashboards practice makes reasoning visible. It gives an executive sponsor a result they can act on and gives the executive reporting owner enough evidence to defend, correct, or retire that result. Begin with a weekly operating-review metric and its drill-through record, define the decision and failure boundary, and build controls that make uncertainty explicit. In the dashboard governance: From there, the system can grow with confidence: each new source, model, and dashboard is added to an operating model instead of becoming another isolated claim about the business
An executive dashboard becomes dependable when its plain-language promise survives a real correction. Keep the decision window, metric grain, source authority, freshness state, access rule, and revision history beside the result. When an input changes, identify affected outputs and decide whether to recompute, annotate, or pause publication; do not let a silent correction rewrite a leadership conversation. A small worked example gives sponsors and operators the same reference point and makes the next review faster. Precision is not the enemy of plain language: it is what lets a reader act without mistaking a partial number for a complete one.
Plain language does not mean removing useful precision. Say whether a number is a count, rate, estimate, or signed-off result; explain the time boundary; and label values that are partial or delayed. Readers can then act quickly without mistaking a convenient summary for the complete operational truth. That vocabulary discipline is often more valuable than another visual style choice.
Authoritative context for dashboard governance: Microsoft Fabric governance roadmap; Understand star schema and its importance to Power BI; PROV-DM: The PROV Data Model; dbt documentation: data tests. These references anchor the article-specific guidance in current technical and operating practice, while the local owner remains responsible for applying the evidence to the dashboard governance decision.