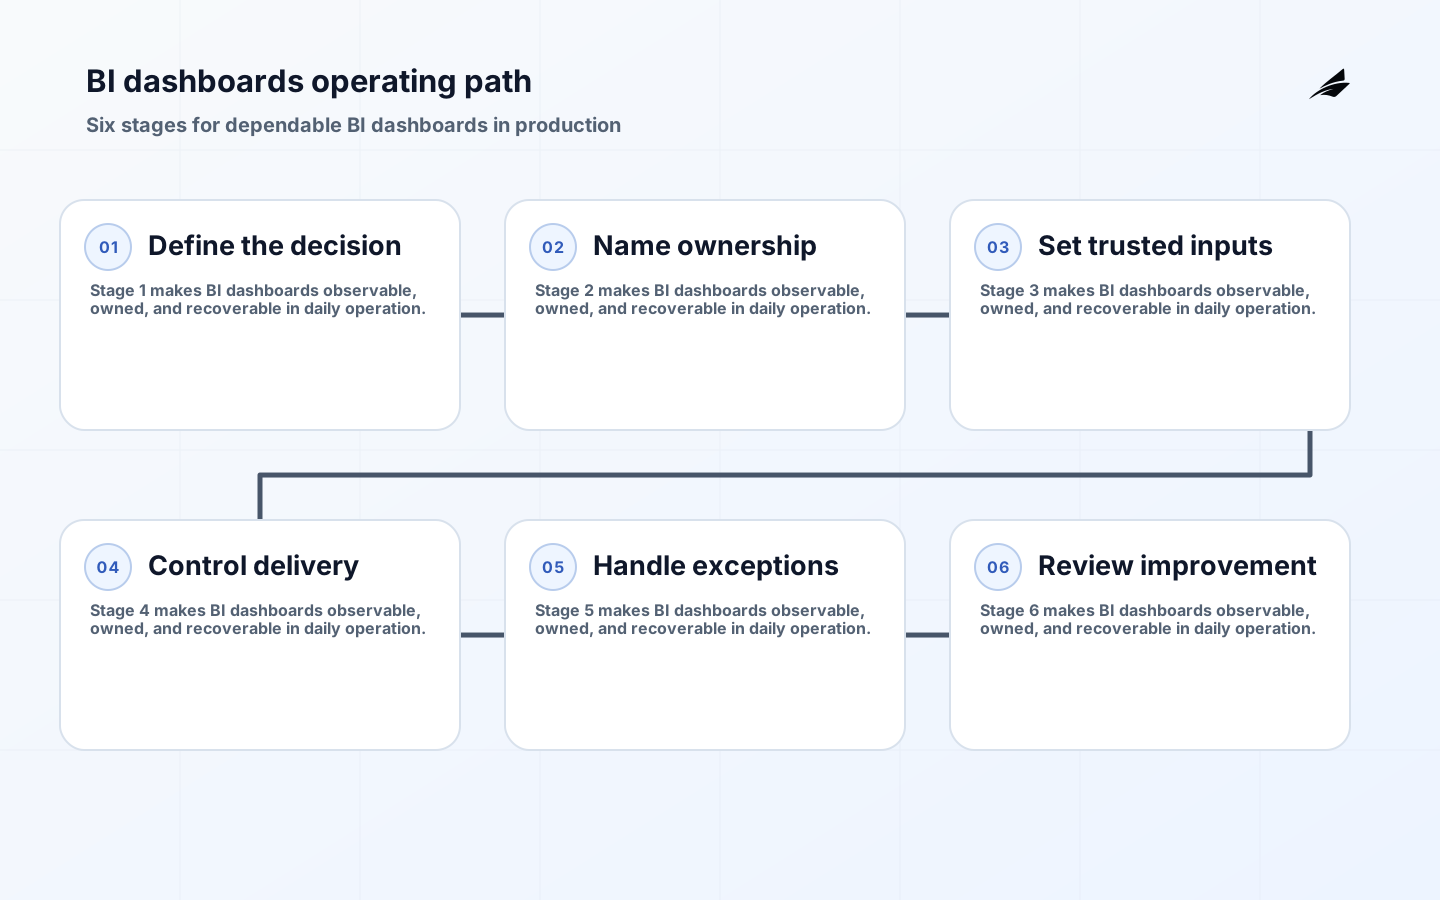
BI Dashboards: Decisions That Matter Before the First Build
BI dashboards becomes a production capability when people rely on it for a recurring decision, not when a first chart, model, schema, or job has been delivered. Consider a weekly operating meeting choosing which customer escalations, inventory issues, and delivery risks deserve attention. The team needs more than a plausible output: it needs a shared definition of meaning, a clear statement of how current the result is, an owner who can act, and an explanation when the result changes. This boundary turns BI dashboards from a project artifact into an operating capability and focuses investment on a particular uncertainty rather than another place where people must hunt for answers.
The first useful question is, “what would a responsible person do differently if this result were available?” For BI dashboards, the answer determines grain, latency, access pattern, and control level. A reliable design starts with status, threshold, trend, comparison period, refresh time, and drill-through identifier. It gives those inputs accountable owners, preserves enough context to explain the output, and makes the exception route visible. Platform choice matters, but an output without a correction path can make a decision faster and less defensible at the same time.
Why BI dashboards changes in production
Early BI dashboards work optimises for discovery: can a source be queried, can a result be produced, can a transformation run? Production introduces more demanding questions. Can a new teammate understand the decision boundary? Can the result be reconstructed after a source correction? Can a material change be reviewed before it alters an established workflow? Can users see assumptions, last successful update, and next action? These are design questions rather than paperwork. They decide whether the capability retains credibility after launch and can be safely handed to the people who run the work.
official implementation guidance is a useful technical reference for this subject, while the related provenance and validation references explain complementary controls. The practical inference is organisational: a documented mechanism becomes dependable only when its assumptions appear in delivery checks and daily work. For BI dashboards, the aim is not to eliminate every edge case. It is to give normal work, degraded conditions, and recovery distinct, understandable behaviour. Users should know when to trust an answer, when to pause, and who should investigate.
The operating model: decisions, ownership, and change
Give the business owner authority over meaning and priority; give the technical owner responsibility for implementation, observability, and recovery; and give consumers a clear route to report ambiguity. This prevents the familiar stall where everyone sees a questionable result but no one can decide whether it is wrong, late, or merely unexpected. Review BI dashboards with real evidence: recent exceptions, material changes, unanswered questions, and a sample of decisions. This cadence exposes gaps before they become an expensive redesign. The owner should explain both intended value and the cost of an incorrect or unavailable result.
| Operating question | Decision | Evidence |
|---|---|---|
| Who relies on it? | Name user and recurring decision. | Audience, cadence, action owner. |
| What is trusted? | Set source, definition, and timing. | Version, lineage, tests, last run. |
| What happens on failure? | Choose visible degraded state. | Alert owner and reconciliation. |
| How does it change? | Review material changes. | Impact assessment and effective date. |
A production architecture for BI dashboards
Separate source evidence, controlled logic, publication, and observation. Retain status, threshold, trend, comparison period, refresh time, and drill-through identifier close to where they can be validated. Publish only the decision-ready result and context the audience needs, while preserving an authorised route back to supporting detail. The central risk is a polished page that removes context and sends people back to spreadsheets. A practical safeguard is a declared owner, explicit expected state, and traceable correction record. This does not demand a large platform on day one. It demands boundaries: an input can be quarantined, an output can declare itself stale, and a repair can be traced rather than silently overwritten. Those properties make investigation possible when a decision is challenged.

| Layer | Responsibility | Failure signal |
|---|---|---|
| Source evidence | Capture identity, time, business context. | Missing keys or unexpected volume. |
| Controlled logic | Apply agreed definition and checks. | Failed test or reconciliation gap. |
| Published result | Present decision-ready context. | Stale result or unavailable detail. |
| Operations | Observe delivery and recovery. | Unowned alert or recurring dispute. |
A practical rollout path for BI dashboards
Start with one decision frequent enough to expose real conditions but limited enough to supervise closely. Use representative historical cases and recent live cases; compare the new result with the current method, including uncomfortable exceptions. Before widening access, ask an intended user to locate the explanation, source context, and next action without help from the delivery team. A disciplined BI dashboards rollout produces a named baseline, release record, support contact, and recovery exercise. That evidence is more valuable than a long feature list because it tests whether the operating agreement works under pressure.
- Write the decision statement for BI dashboards and agree it with the action owner.
- Model the smallest useful path using status, threshold, trend, comparison period, refresh time, and drill-through identifier, including incomplete cases.
- Make expected state, last update, and exception path visible.
- Test access, definition, and recovery before routine use.
- Compare the pilot with the prior process and record delay or rework.
- Expand only after the owner can explain detection, communication, and correction.
Signals that show whether BI dashboards is operating
Measure BI dashboards through behaviour and reliability together. Track decisions completed with the dashboard instead of report opens alone; delivery or freshness; the count and age of unresolved exceptions; definition or access questions; and time from detection to a corrected, explained result. Add a qualitative check by asking users which decision they changed recently and what evidence they used. A high view count, query volume, or job-success rate can be useful context, but cannot prove the capability improves work. A short-lived rise in questions can even be healthy when it exposes definitions that were assumed rather than agreed.
Key takeaways
- BI dashboards should begin with a decision and accountable user, not tool selection.
- Treat meaning, timing, and correction as visible parts of the experience.
- Keep source evidence and changes traceable enough to explain a contested result.
- Pilot one consequential workflow, rehearse its unhappy path, then use observed behaviour to choose scope.
Frequently asked questions about BI dashboards
What is the first production milestone for BI dashboards?
The first milestone is a supervised, repeatable decision path: a named user can obtain the result, see context, follow an exception to a responsible owner, and compare it with underlying evidence. For BI dashboards, this is stronger than a proof of concept because it exercises definition, access, timing, and support together. Keep scope narrow enough for the owner to review every surprising outcome during the first operating cycle.
Do we need a new platform before putting BI dashboards into production?
Usually not. First establish whether current tools can record required inputs, apply agreed rules, expose the result safely, and leave an auditable correction path. A new platform is justified when it removes a concrete reliability, scale, access-control, or maintainability limit. The official implementation guidance helps evaluate implementation choices, but it cannot replace a decision about ownership and operating requirements.
How often should the team review BI dashboards?
Review it at the cadence of the decision and whenever a material upstream or business rule changes. A daily workflow may need a weekly exception review; a monthly planning product may need a monthly review plus release checks. Do not let a fixed calendar substitute for signals. Repeated exceptions, metric disputes, missed deadlines, or parallel spreadsheets are reasons to investigate immediately. Review BI dashboards with the meetings they support. Watch which signals lead to decisions, which tiles require explanation, and whether users still export data to work around the page.
BI-dashboard evidence should include the intended decision in the visual brief, not merely the title of a chart. A manager looking at a rising backlog needs the comparison, threshold, owner, and available action. That context reduces decorative reporting and keeps visual design tied to the operational handoff the dashboard is meant to support.
Conclusion: make BI dashboards dependable before making it broad
A dashboard brief should be tested in the meeting it is meant to support. For each high-level visual, record the decision it informs, the comparison period, threshold, refresh time, owner, and drill-through record. In the operating-meeting example, give managers realistic exceptions and ask them to prioritise work without a facilitator explaining the page. Notice whether they understand a signal, whether they need to export data, and whether they can reach the underlying case. Those observations are stronger evidence than preference polls. Keep visual density low enough that the highest-priority information is obvious, then provide detail through the report or operational system. The result should support a decision and a handoff, not turn the meeting into a debate about labels, filters, or which total is correct.
The durable version of BI dashboards is not the largest implementation. It is the one that helps engineering teams make a specific decision with known meaning, current-enough evidence, accountable ownership, and a credible correction route. Begin with a weekly operating meeting choosing which customer escalations, inventory issues, and delivery risks deserve attention. Establish controls and measurements that make this path inspectable. Then extend the capability only after the first workflow can survive change, error, and scrutiny without relying on the people who originally built it.