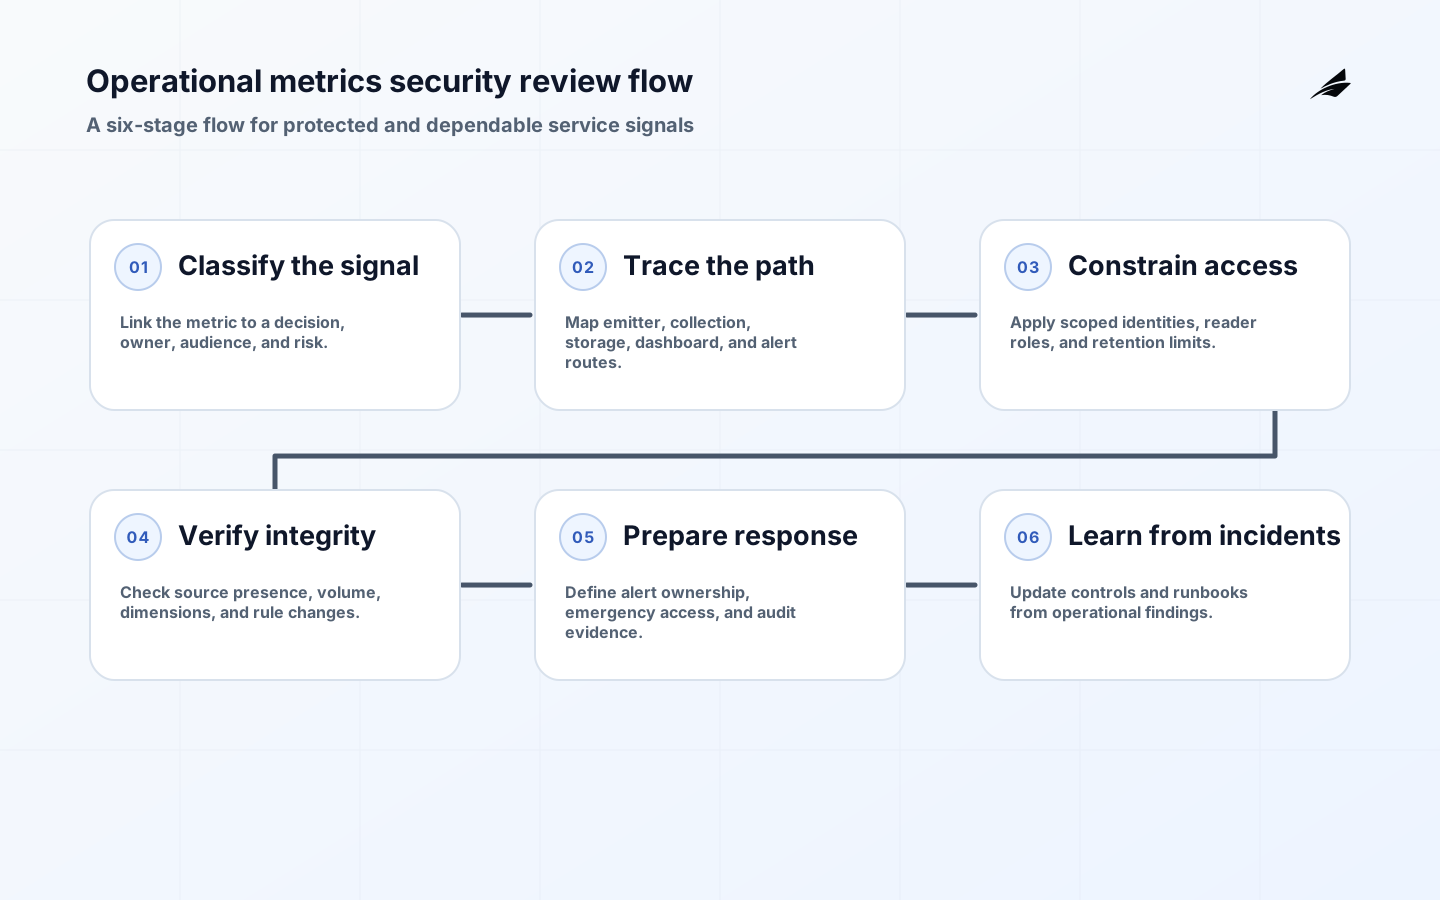
An operational metrics security review asks whether the signals used to run a service are both useful and appropriately protected. Availability, latency, error rates, queue depth, deployment status, and customer-impact measures can reveal sensitive infrastructure, customer behavior, or incident details when combined or exposed broadly. At the same time, over-restricting them can slow responders who need evidence during an outage. The review balances these needs by defining the decision supported by each metric, classifying its inputs and implications, limiting access by role, and preserving an auditable path from alert to source evidence. NIST SP 800-53 Rev. 5 frames access and change controls, while NIST SP 800-92 Log Management supports the evidence-retention discussion. For adjacent practice, compare operational KPI controls, data-pipeline planning, and dbt model security review.
Classify metrics by decision and risk
Start with what the metric enables. A public service-health indicator, an internal on-call alert, and an executive capacity trend can reference related systems but have very different exposure and freshness requirements. Record the owner, audience, action, data sources, and sensitivity of each metric. Consider indirect exposure: a per-customer failure view, a detailed deployment timeline, or a low-volume regional chart can reveal more than its label suggests. Classification should be specific enough to drive controls without making teams treat every monitoring value as equally restricted.
- Link each metric to an operational decision, owner, and intended audience.
- Classify source fields and derived signals for direct and indirect sensitivity.
- Separate public status communication from internal diagnostic detail.
- Document expected freshness, retention, and the authoritative producer.
- Review whether metric combinations reveal protected customer or infrastructure context.
Secure collection, storage, and reader access
Trace operational metrics from emitter through collector, transformation, storage, dashboard, alerting rule, and export path. Each handoff can introduce a service identity, a broad query role, or an uncontrolled copy. Segment access by the work being performed: an on-call engineer may need detailed diagnostics during an incident, while a planning team may need an aggregate trend. Protect credentials and tokens used by collectors, and ensure logs or labels do not contain secrets or unnecessary personal data. The OpenTelemetry Metrics Data Model is a useful reference for metric structure; design the collection-to-use path deliberately rather than copying every available field.
| Layer | Security question | Control example |
|---|---|---|
| Emitter | Can event labels contain secrets or identifiers? | Schema review and allowlisted fields. |
| Collection | Which identity sends and reads metrics? | Scoped service identities and credential rotation. |
| Storage | Who can query raw versus aggregate data? | Role-based datasets and retention policies. |
| Dashboard and alerts | What detail does each reader need? | Audience-specific views and governed notification routes. |
Protect metric integrity and incident response
Security also includes whether a metric can be trusted during an incident. Define authoritative producers, guard against unauthorized rule changes, monitor missing or anomalous telemetry, and retain enough history to explain an alert. A failed metric pipeline should be distinguishable from a healthy service with zero traffic. Prometheus metric types clarifies how counters, gauges, and other signals behave; for analytical transformations, dbt data tests provides a pattern for asserting expected data properties. Operational telemetry also needs collection and alert-path checks. Document who may silence an alert, change a threshold, or alter a service-level indicator, and preserve an audit trail.
- Validate source presence, expected volume, and critical dimensions before trusting a trend.
- Protect alert and dashboard configuration with review and change history.
- Set emergency access paths that are time-bound and auditable.
- Distinguish telemetry failure from the service condition being measured.
- Include metric integrity checks in incident drills and post-incident review.
Run the operational metrics security review continuously

Run a focused review when a service, audience, data source, or diagnostic workflow changes, and revisit critical metrics after incidents. The review can be lightweight when a change is low risk, but it should still confirm purpose, inputs, access, retention, and response ownership. NIST SP 800-61 Incident Handling Guide supports the response and review cadence. Operational KPI systems is a helpful companion for linking measures to controlled action. Security is sustained by clear responsibilities and data-management practice, not an initial permission setup alone.
| Review trigger | Question to revisit | Outcome |
|---|---|---|
| New service or emitter | Does the schema introduce sensitive or untrusted data? | Approve fields, identities, and retention before ingestion. |
| New dashboard audience | What minimum detail supports the new decision? | Create an appropriate view and access policy. |
| Alert rule change | Can it be changed or silenced without review? | Apply version control, approvers, and audit logging. |
| Incident finding | Did telemetry or access hinder response? | Update controls, runbooks, and tests. |
A practical operational metric security example
Consider an on-call dashboard for a multi-tenant service. Responders need to see error rate, request latency, deployment version, queue depth, and which dependencies are affected. A public service-health page may need only a high-level incident state. The design should create separate views from a shared, controlled metric foundation rather than exposing the internal dashboard and hoping readers ignore details. Per-tenant labels, request identifiers, infrastructure topology, and diagnostic messages may be essential during incident response yet unnecessary for a broader audience. Each view should have a clear purpose, role, and retention policy.
Metric integrity becomes visible when a collector fails. If no traffic appears after a deployment, a responder must be able to tell whether the application is quiet, the emitter stopped sending, the collector credentials expired, or a transformation delayed publication. Track the health of the telemetry path itself and show enough status to interpret an empty chart. A naïve zero can cause a team to close a real incident or miss one entirely. By monitoring source presence, expected volume, and end-to-end delay, the operational system treats the measurement path as a dependency worthy of its own controls.
After an incident, review both the service behavior and the information boundary. Did an alert send detailed customer context to a channel with an overly broad audience? Did a temporary access grant remain active after the incident? Did a metric label include a token or personal identifier? The remediation should correct the configuration, record the affected scope, and update the relevant schema checks, access rules, or runbook. These small improvements compound: they help teams respond quickly next time while steadily reducing the chance that urgent diagnostics become an uncontrolled data-distribution channel.
- Classify each metric by its operational decision, intended audience, and direct or indirect sensitivity.
- Review metric labels and dimensions for secrets, personal data, customer identifiers, and topology exposure.
- Map service identities and reader roles across emitters, collectors, storage, dashboards, and alerts.
- Use separate public, leadership, and responder views instead of broad diagnostic dashboards.
- Monitor telemetry-path health so empty values are not mistaken for healthy service behavior.
- Protect alert thresholds, routing rules, and silencing actions with review and audit history.
- Define time-bound, auditable emergency access for responders who need additional diagnostic detail.
- Set retention and deletion rules for raw metrics, high-cardinality labels, and incident artifacts.
- Include metric integrity and access questions in incident exercises and retrospective reviews.
- Remove obsolete alerts, collectors, dashboards, and credentials that no longer support service operation.
Build security into the responder experience. During an incident, an engineer should know which dashboard is the approved diagnostic view, which role grants additional access, and how to record an access elevation without pausing the response unnecessarily. Afterwards, the temporary path should close automatically or be reviewed promptly. Design the alert messages to carry enough context for routing, then require the responder to enter the protected view for sensitive detail. This avoids the common pattern where every alert becomes an uncontrolled snapshot of internal operations distributed across long-lived chat and email histories.
Key takeaways for operational metrics security
- Classify metrics by the decisions they support and the exposure they create.
- Secure the complete route from emitter to alert and export.
- Protect metric integrity so incidents are not guided by broken telemetry.
- Review controls whenever services, audiences, or response workflows change.
Frequently asked questions: securing operational metrics
Are operational metrics sensitive? Some are public by design, but detailed labels, per-customer views, topology, and incident context can be sensitive. Should on-call teams have broad access? Give responders the access needed for their role, with emergency elevation that is constrained and auditable where necessary. What is metric integrity? Confidence that the signal is produced by the intended source, complete enough for its purpose, and resistant to unauthorized changes. How often should reviews happen? At meaningful change, after incidents, and periodically for critical services.
Conclusion
Operational metrics are part of the service-control surface. They need enough fidelity to guide an engineer under pressure and enough protection that diagnostic detail does not spread beyond its purpose. By classifying each metric, securing the path it travels, checking its integrity, and reviewing changes in the normal operating rhythm, teams can preserve both fast response and responsible access. The result is telemetry that is useful when it matters most and defensible when it is inspected later.
The review is complete only when a responder can use the signal without widening access by instinct. Keep the metric definition, source query, owner, freshness expectation, and permitted audience together. Test whether an alert can be traced back to source evidence and whether a change in collection or aggregation is visible to the people who rely on it. During an incident, record emergency access and retire it when the response ends. Afterward, check whether the signal exposed more customer or infrastructure detail than the decision required. This is a practical balance: protect identifiers and sensitive combinations, preserve enough context to diagnose a real failure, and make the trade-off explicit. A secure metrics estate is therefore not a locked dashboard; it is a governed evidence path that remains trustworthy when the service, team, or incident changes.
An operational metrics security review should separate measurement value from access authority. Classify dimensions and identifiers, restrict sensitive labels, define retention, and test whether a reader can infer more about a person, customer, or system than the decision requires. Review dashboards, exports, alerts, and raw event paths together. A useful control is one that lets an owner prove the signal is trustworthy without making the underlying sensitive data broadly visible.