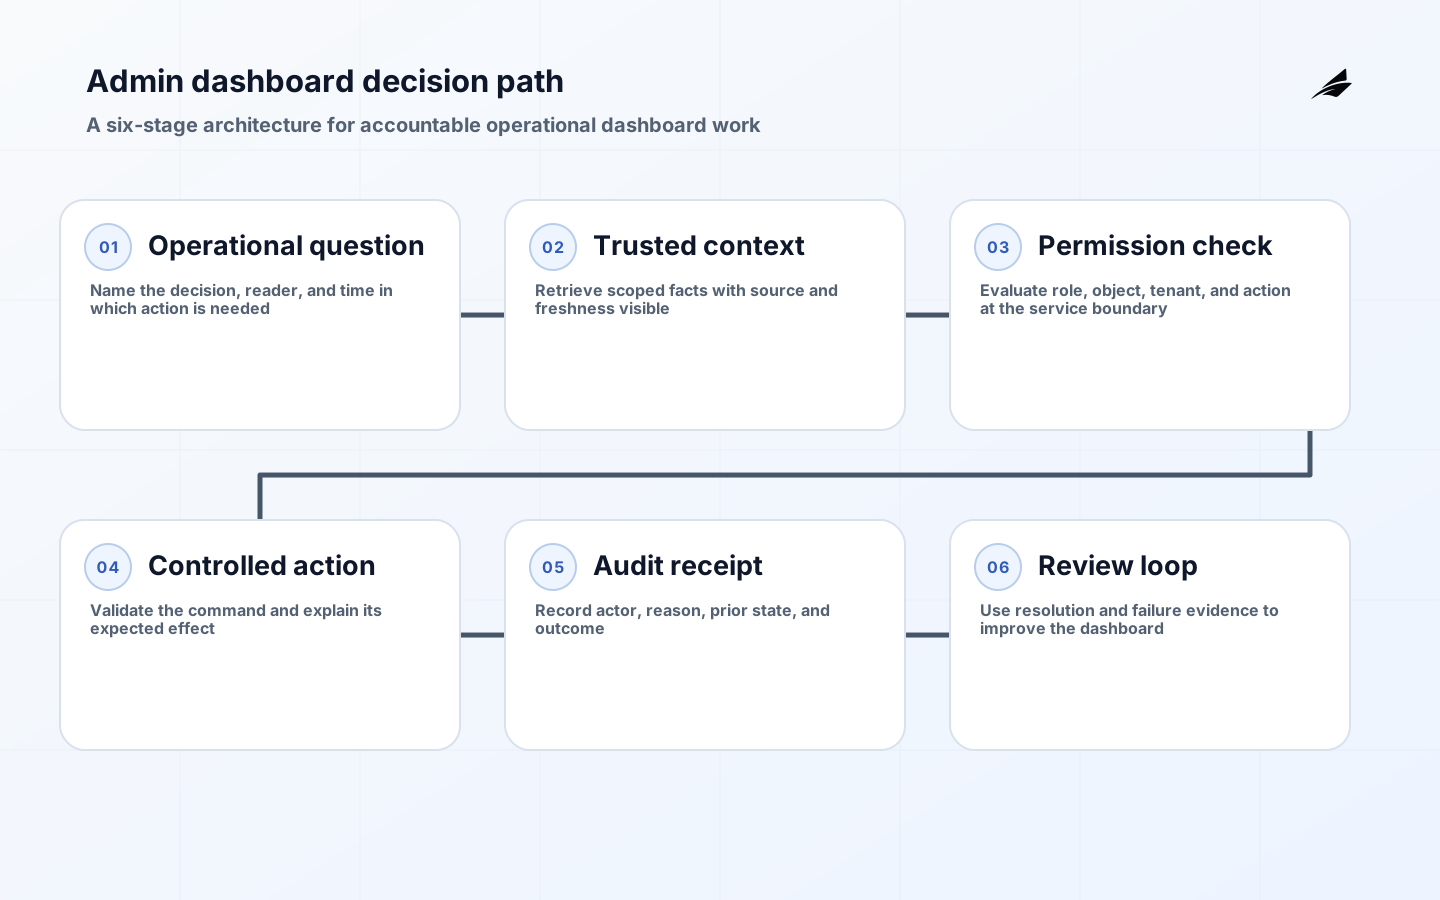
Admin dashboard architecture should start with the decisions an operator must make in a busy hour, not with charts or a component library. A useful dashboard helps a person notice a condition, understand the evidence, take a permitted action, and later explain what happened. That sequence is more demanding than arranging metrics on a grid. Product leaders should spend discovery time beside the people who resolve exceptions, correct records, approve changes, and answer customer questions. Watch where they leave the current system to search, compare, or obtain permission. Those detours reveal missing context, unclear ownership, and unsafe shortcuts. The first architectural objective is therefore modest: make one frequent operational decision quicker and more accountable without creating a second system of record.
Key takeaways
- Treat every dashboard surface as a decision and action loop, not a reporting canvas.
- Keep business records authoritative in their owning systems; display derived context with its freshness visible.
- Authorize actions on the server for the specific object, tenant, and role involved.
- Design for keyboard use, understandable status changes, and recovery from failed actions.
- Measure whether the dashboard shortens resolution time and reduces unsafe workarounds.
Map decisions before widgets
List the operational questions in the language of the team: Which accounts need review today? Which order can be released? Why did a case fail? Who owns the next step? For each question, identify the reader, the decision deadline, the authoritative facts, the permitted actions, and the consequence of a wrong choice. Separate an informational metric from a control. A backlog count may inform staffing, while a button that changes a customer state is a control that needs stronger validation and audit evidence. This distinction keeps the admin dashboard architecture honest. It also prevents a familiar failure mode: a visually complete page that leaves operators unable to complete the work that caused them to open it.

| Decision | Minimum context | Control requirement |
|---|---|---|
| Prioritize a case | Age, severity, customer impact, owner | Explain ranking inputs and allow a documented override |
| Correct a record | Current value, source, prior changes | Confirm intent, validate server-side, retain reason |
| Approve an exception | Policy threshold and supporting evidence | Check delegated authority and record approver |
| Investigate a failure | Correlation ID, dependency status, timestamp | Link only to information the viewer may access |
Model data, freshness, and grain
A dashboard becomes misleading when it combines values that look comparable but have different update times or scopes. Define the grain of every figure: one row per order, account, attempt, day, or queue item. Then document whether it is live, periodically refreshed, or calculated from a snapshot. Operators do not need implementation trivia, but they do need a visible warning when the source is stale enough to affect a decision. Avoid copying whole customer records into a dashboard store merely for convenience. Keep stable identifiers and fetch sensitive detail only when a user has a legitimate task. Where a derived metric is used for intervention, provide a route to the underlying records so people can challenge the result rather than treating a score as an unexplained verdict.
Design the dashboard permission model
The dashboard permission model needs more precision than a menu hidden for junior users. Define each action against an object and context: a support lead may reopen a case in their region, while a finance approver may release a credit only below a delegated limit. Apply the check at the API or command handler, then make the interface reflect the outcome clearly. The OWASP Application Security Verification Standard is a practical checklist for turning that rule into tests. Plan a short-lived elevated-access path for exceptional work, with approval, expiry, and review. Bulk export, impersonation, and irreversible actions deserve separate treatment because their operational value and exposure are both high.
| Surface | Typical risk | Design response |
|---|---|---|
| Queue list | Cross-tenant disclosure | Filter at query boundary and test direct URL access |
| Detail panel | Stale or incomplete context | Show source and refresh state beside critical values |
| Bulk action | Large unintended change | Require scoped selection, preview, confirmation, and result receipt |
| Audit view | Sensitive history exposed | Limit fields by role and protect access to exported evidence |
Make dense work accessible
Dense does not have to mean difficult. Use a predictable reading order, persistent labels, and a keyboard route through filters, results, and actions. Announce meaningful updates such as saved changes, validation failures, or a queue refresh without forcing someone to hunt for them. WCAG 2.2 is especially useful when reviewing focus appearance, target size, error identification, and accessible authentication. Prefer progressive disclosure over a wall of permanently expanded controls, but do not conceal the status or owner that makes a case actionable. Test with realistic data volumes and long names; an elegant empty-state layout often fails when an operator is comparing twenty rows under time pressure.
Build a thin action slice
Choose one end-to-end workflow for the first release, such as triaging a failed payment, assigning it, adding evidence, and closing it with a reason. The slice should include identity, query, permission, command, audit event, failure message, and a supportable recovery path. That scope exposes contractual weaknesses earlier than building separate mockups for list, detail, and settings screens. Follow NIST SSDF practices by recording the security requirements, protecting the build, reviewing dependencies, and keeping test evidence. A dashboard is operational software; deployment quality matters as much as visual polish because an unavailable or misleading control surface can stop real work.
Observe actions, not just page loads
Instrument the journey around user intent. Capture a correlation identifier when a case is opened, an action is attempted, a dependency is called, and an outcome is returned. Do not put sensitive customer content into telemetry merely to make debugging easy. The OpenTelemetry Specification provides common concepts for traces, metrics, and logs that can connect the interface to the service path. Review action latency, failed command rate, stale-data incidents, and time from alert to resolution. Pair those technical measures with observation: are people completing the task in the dashboard, or are they still using spreadsheets and private messages when pressure rises?
Run an architecture review before rollout
| Review point | Question to settle before release | Evidence to request |
|---|---|---|
| Primary decision | Which operational choice becomes easier on this page? | Three observed cases and a named accountable operator |
| Data authority | Which source wins when displayed values disagree? | Owner, identifier, refresh interval, and reconciliation procedure |
| Queue ordering | Why does one item appear ahead of another? | Documented ranking inputs with an approved override path |
| Object scope | Which accounts or cases may each role retrieve? | Direct-access tests across tenant, region, and assignment boundaries |
| Action safety | What irreversible effect can this control produce? | Preview, confirmation, server validation, and an outcome receipt |
| Failure visibility | How does an operator learn that a dependency is stale? | User-facing status plus a correlated operational alert |
| Audit quality | Can a later reviewer reconstruct a significant action? | Actor, prior state, reason, timestamp, and related request ID |
| Accessibility | Can keyboard users complete the urgent task quickly? | Focused review using realistic rows, errors, and status changes |
| Support ownership | Who investigates a disputed outcome after hours? | Runbook, escalation contact, and access to safe diagnostics |
| Rollout cohort | Who receives the first release and why? | Representative group, baseline measures, fallback route, and feedback schedule |
| Data growth | What happens when a queue reaches ten times current size? | Query plan, pagination behaviour, and response-time observation |
| Retirement | Which manual report or old page can now stop? | Owner confirmation that the new workflow meets the need |
Release and review
Release to a representative operational group and agree the support owner before broad access. A useful rollout plan includes sample cases, access provisioning, a fallback procedure, and a daily review of unexpected denials or reconciliation problems. Compare baseline and post-release median resolution time, rework, and escalation volume, rather than celebrating raw login counts. DORA research emphasizes measuring delivery and organizational outcomes together; apply that discipline here by checking whether a faster interface also produces better decisions. Remove or revise controls that create friction without improving assurance. The durable dashboard is the one whose data definitions, permissions, and operational habits remain understandable after the original project team has moved on.
Frequently asked questions
What belongs in the first admin dashboard release?
Include one high-value decision with its trusted context, the least-privileged action, a visible outcome, and an audit trail. Add filters only when they change that decision. Advanced personalization, broad reporting, and every historical edge case can wait unless they are necessary to perform the chosen workflow safely.
Does an admin dashboard need real-time data?
Only when the decision becomes unsafe at the proposed refresh interval. Real-time updates add cost and failure modes. For many operations, a clear freshness timestamp, a deliberate refresh, and a reconciliation path are more valuable than a stream that appears live but silently loses events.
Conclusion
Good admin dashboard architecture makes a consequential decision legible and controlled. Begin with the work, establish data authority and permission boundaries, build one complete action path, then measure the operating result. That sequence gives a team a dashboard that earns trust under real conditions rather than merely looking informative in a review meeting.